
What is MESA Colors?
MESA colors is a post-processing and runtime module that allows users to generate "observer-ready" data directly from stellar evolution models. Instead of limiting output to theoretical quantities like Luminosity (L) and Surface Temperature (Teff), the colors module computes:
- Bolometric Magnitude (Mbol)
- Bolometric Flux (Fbol)
- Synthetic Magnitudes in specific photometric filters (e.g., Johnson V, Gaia G, 2MASS J)
This bridges the gap between theoretical evolutionary tracks and observational color-magnitude diagrams (CMDs).
How Does the MESA Colors Module Work?
The module operates by coupling the stellar structure model with pre-computed grids of stellar atmospheres:
- Interpolation: At each timestep, the module takes the star's current surface parameters—Effective Temperature (Teff), Surface Gravity (log g), and Metallicity ([M/H])—and queries a user-specified library of stellar atmospheres (defined in
stellar_atm). It interpolates within this grid to construct a specific Spectral Energy Distribution (SED) for the star's current features. - Convolution: This specific SED is then convolved with filter transmission curves (defined in
instrument) to calculate the flux passing through each filter. - Integration: The fluxes are converted into magnitudes using the user-selected magnitude system (AB, ST, or Vega).
+----------------+
|   MESA Model   |
| (Teff, logg, Z)|
+----------------+
        |
        v
+------------------------------------------------------------+
|               MESA COLORS MODULE                           |
| 1. Query Stellar Atmosphere Grid with input model          |
| 2. Interpolate grid to construct specific SED              |
| 3. Convolve SED with filters to generate band flux         |
| 4. Apply distance flux dilution -> Flux_bol                |
| 5. Apply zero point (Vega/AB/ST) to generate magnitudes    |
|    (Both bolometric and per filter)                        |
+------------------------------------------------------------+
        |
        v
+----------------------+
|    history.data      |
| age, Teff, ...       |
| Mag_bol, Flux_bol    |
| V, B, I, ...         |
+----------------------+
Inlist Options & Parameters
The colors module is controlled via the &colors namelist. Below is a detailed guide to the key parameters.
use_colors
Default: .false.
If set to .true., the colors module is turned on and will calculate bolometric and synthetic magnitudes at every timestep.
instrument
Default: '/colors/data/filters/Generic/Johnson'
This points to the directory containing the filter transmission curves you wish to use. The path must be structured as facility/instrument.
- The directory must contain a file named after the instrument (e.g.,
Johnson) which acts as an index. - The module will read every
.datfile listed in that directory and create a corresponding history column for it.
Example:
instrument = '/colors/data/filters/GAIA/GAIA'
stellar_atm
Default: '/colors/data/stellar_models/Kurucz2003all/'
Specifies the path to the directory containing the grid of stellar atmosphere models. This directory must contain:
- lookup_table.csv: A map linking filenames to physical parameters (Teff, log g, [M/H]).
- SED files: The actual spectra (text or binary format).
- flux_cube.bin: (Optional but recommended) A binary cube for rapid interpolation.
Example:
stellar_atm = '/colors/data/stellar_models/sg-SPHINX/'
distance
Default: 3.0857d19 (10 parsecs in cm)
The distance to the star in centimeters.
- This value is used to convert surface flux to observed flux.
- Default Behavior: It defaults to 10 parsecs, resulting in Absolute Magnitudes.
- Custom Usage: You can set this to a specific source distance to calculate Apparent Magnitudes.
Example (Betelgeuse distance):
distance = 5.1839d20
mag_system
Default: 'Vega'
Defines the zero-point system for magnitude calculations. Options are:
- 'AB': Based on a flat spectral flux density of 3631 Jy.
- 'ST': Based on a flat spectral flux density per unit wavelength.
- 'Vega': Calibrated such that the star Vega has magnitude 0 in all bands.
vega_sed
Default: '/colors/data/stellar_models/vega_flam.csv'
Path to the Vega SED file, used for Vega photometric system zero points.
make_csv
Default: .false.
If set to .true., the module exports the full calculated SED at every profile interval.
- Destination: Files are saved to the directory defined by
colors_results_directory. - Format: CSV files containing Wavelength vs. Flux.
- Use Case: Useful for debugging or plotting the full spectrum of the star at a specific age.
colors_results_directory
Default: 'SED'
The folder where CSV files (if make_csv = .true.) and other debug outputs are saved.
Test Suite Usage
The MESA colors test suite evolves a complete stellar model (from the pre-main sequence onward) while the colors module runs continuously in the background. At every timestep, MESA computes synthetic photometry by interpolating a stellar atmosphere grid and convolving the resulting SED with the filters you specify in the inlist.
What the Test Suite Produces
The standard output includes:
| Column Name | Description |
|---|---|
Mag_bol |
The bolometric magnitude computed from the star's instantaneous bolometric flux. |
Flux_bol |
The bolometric flux (cgs units) after distance dilution is applied. The default distance is 10 pc, producing absolute magnitudes unless changed. |
[Filter_Name] |
A synthetic magnitude column for every filter in the instrument directory. |
For example, if your filter directory contains B.dat, V.dat, and R.dat, your history file will include B, V, and R as new magnitude columns generated automatically at runtime.
history_columns.list—the module detects the available filters by inspecting the directory defined in the instrument parameter.
Installation and Setup
Prerequisites:
- MESA SDK properly configured and compatible with your MESA version
- Environment variables
MESA_DIRandMESASDK_ROOTproperly set - Atmosphere + filter data directories properly installed
Clone and Build the Test Case:
# Clone the custom colors repository
git clone https://github.com/nialljmiller/MESA_custom_colours.git
cd MESA_custom_colours

# Clean, build, and run
./clean
./mk   # Downloads testdata.txz and extracts atmosphere models
./rn   # Runs the test case
Python Helper Scripts
A collection of Python scripts is provided in the python_helpers/ directory to assist with real-time monitoring, visualization, and analysis of the colors module output.
Dependencies
matplotlibnumpymesa_readerffmpeg(optional, for movie generation)
HISTORY_check.py
Usage: python python_helpers/HISTORY_check.py
A real-time dashboard that monitors your history.data file as MESA runs. It automatically refreshes when new data is written.
Plots:
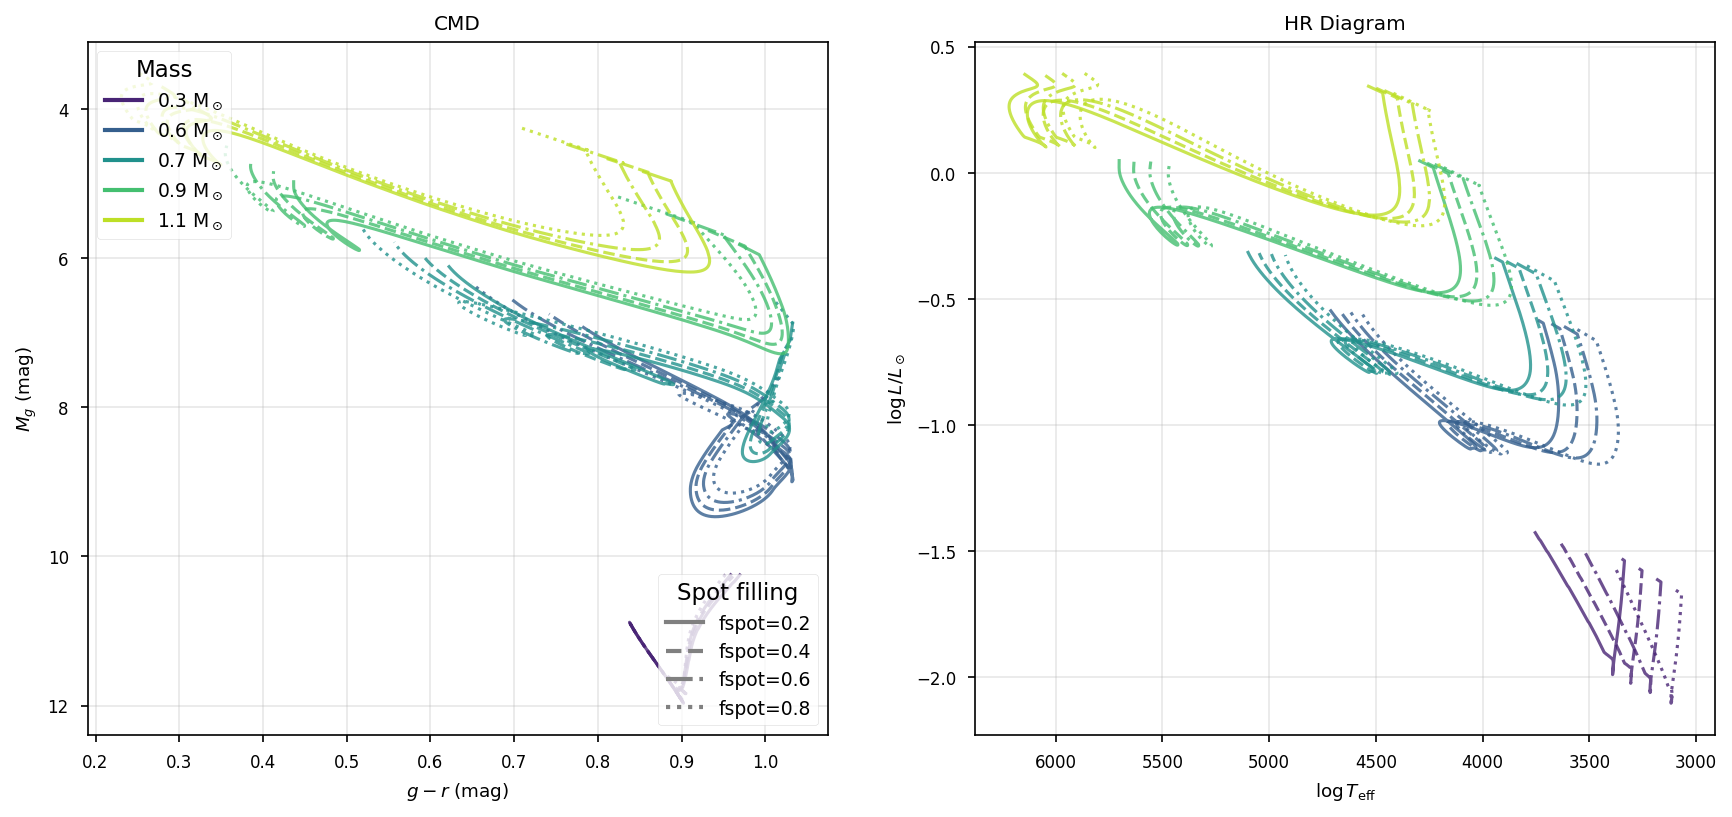
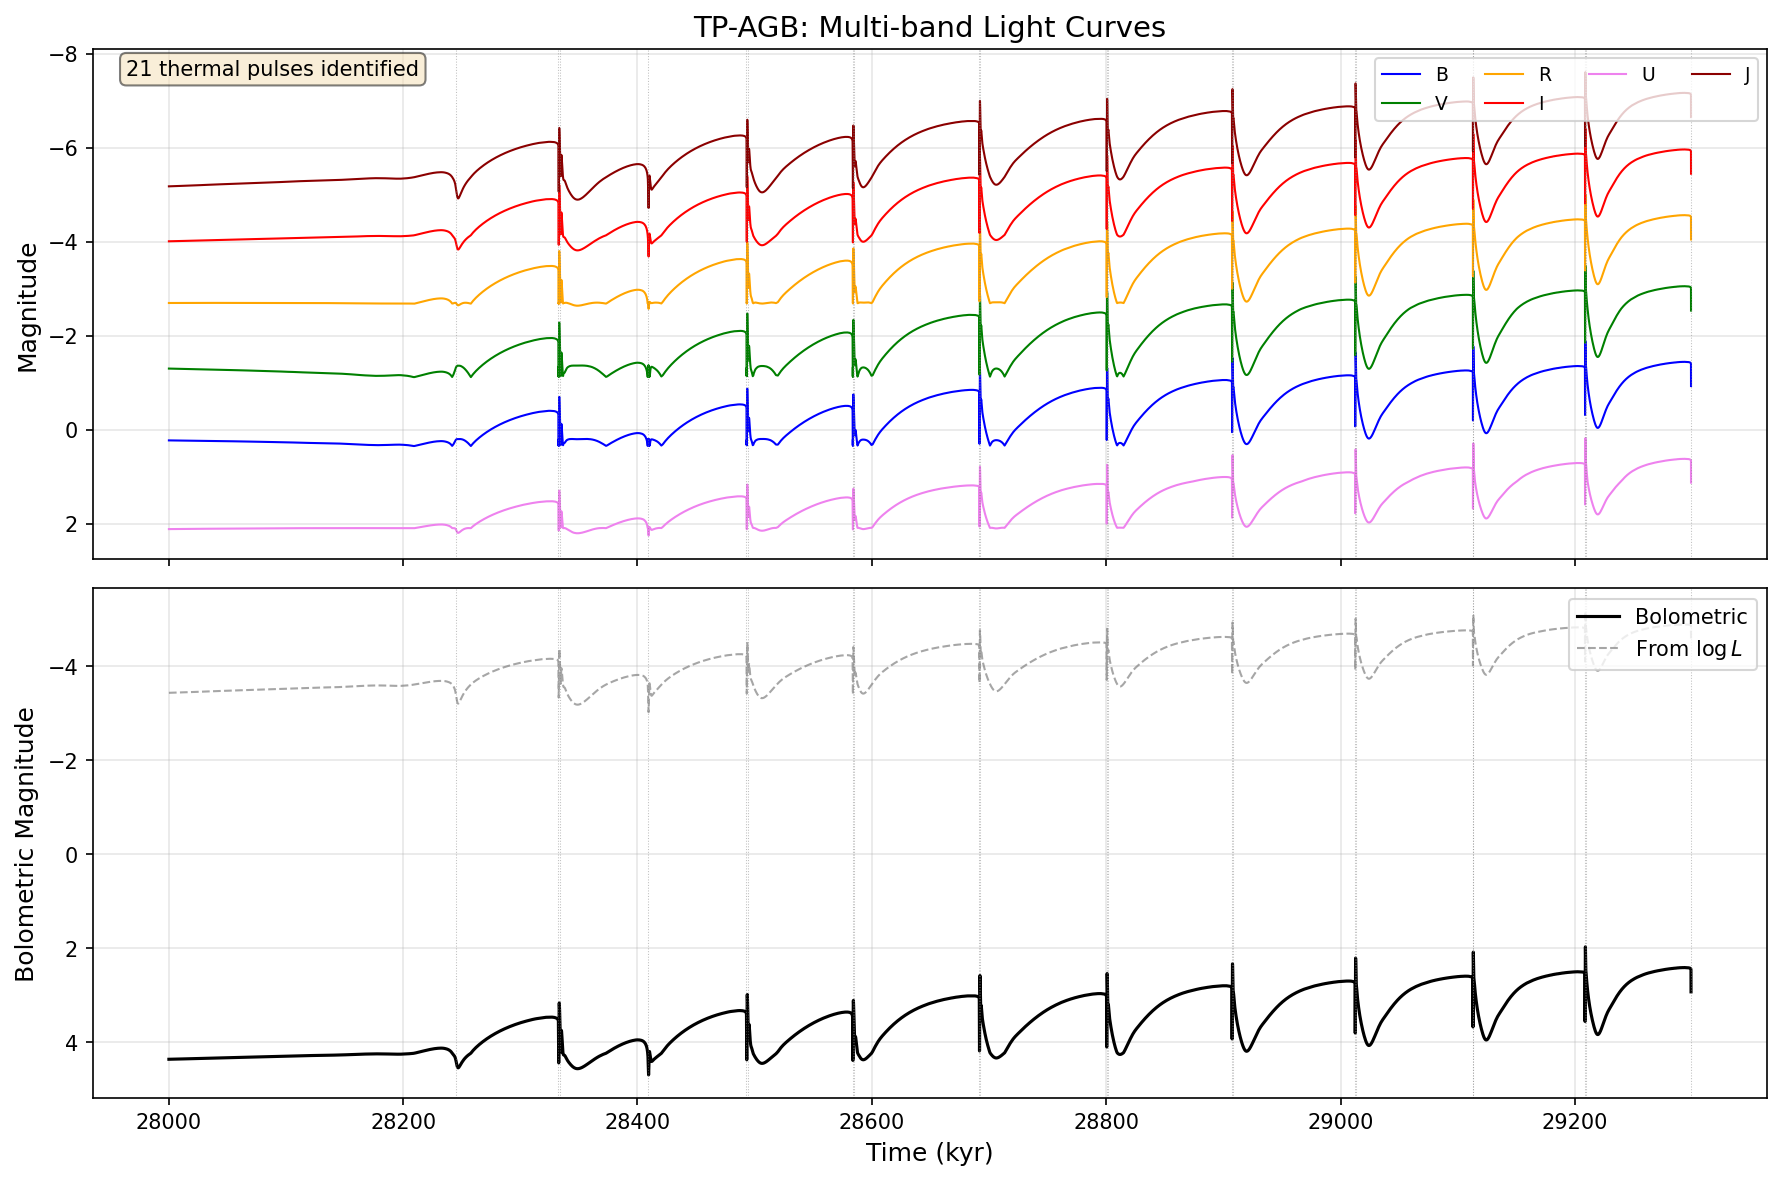
- HR Diagram (Color vs. Magnitude): Points colored by evolutionary phase.
- Theoretical HR (Teff vs. Log L): Standard theoretical track.
- Color Evolution: Color index vs. Age.
- Light Curves: Absolute magnitude vs. Age for all filters.
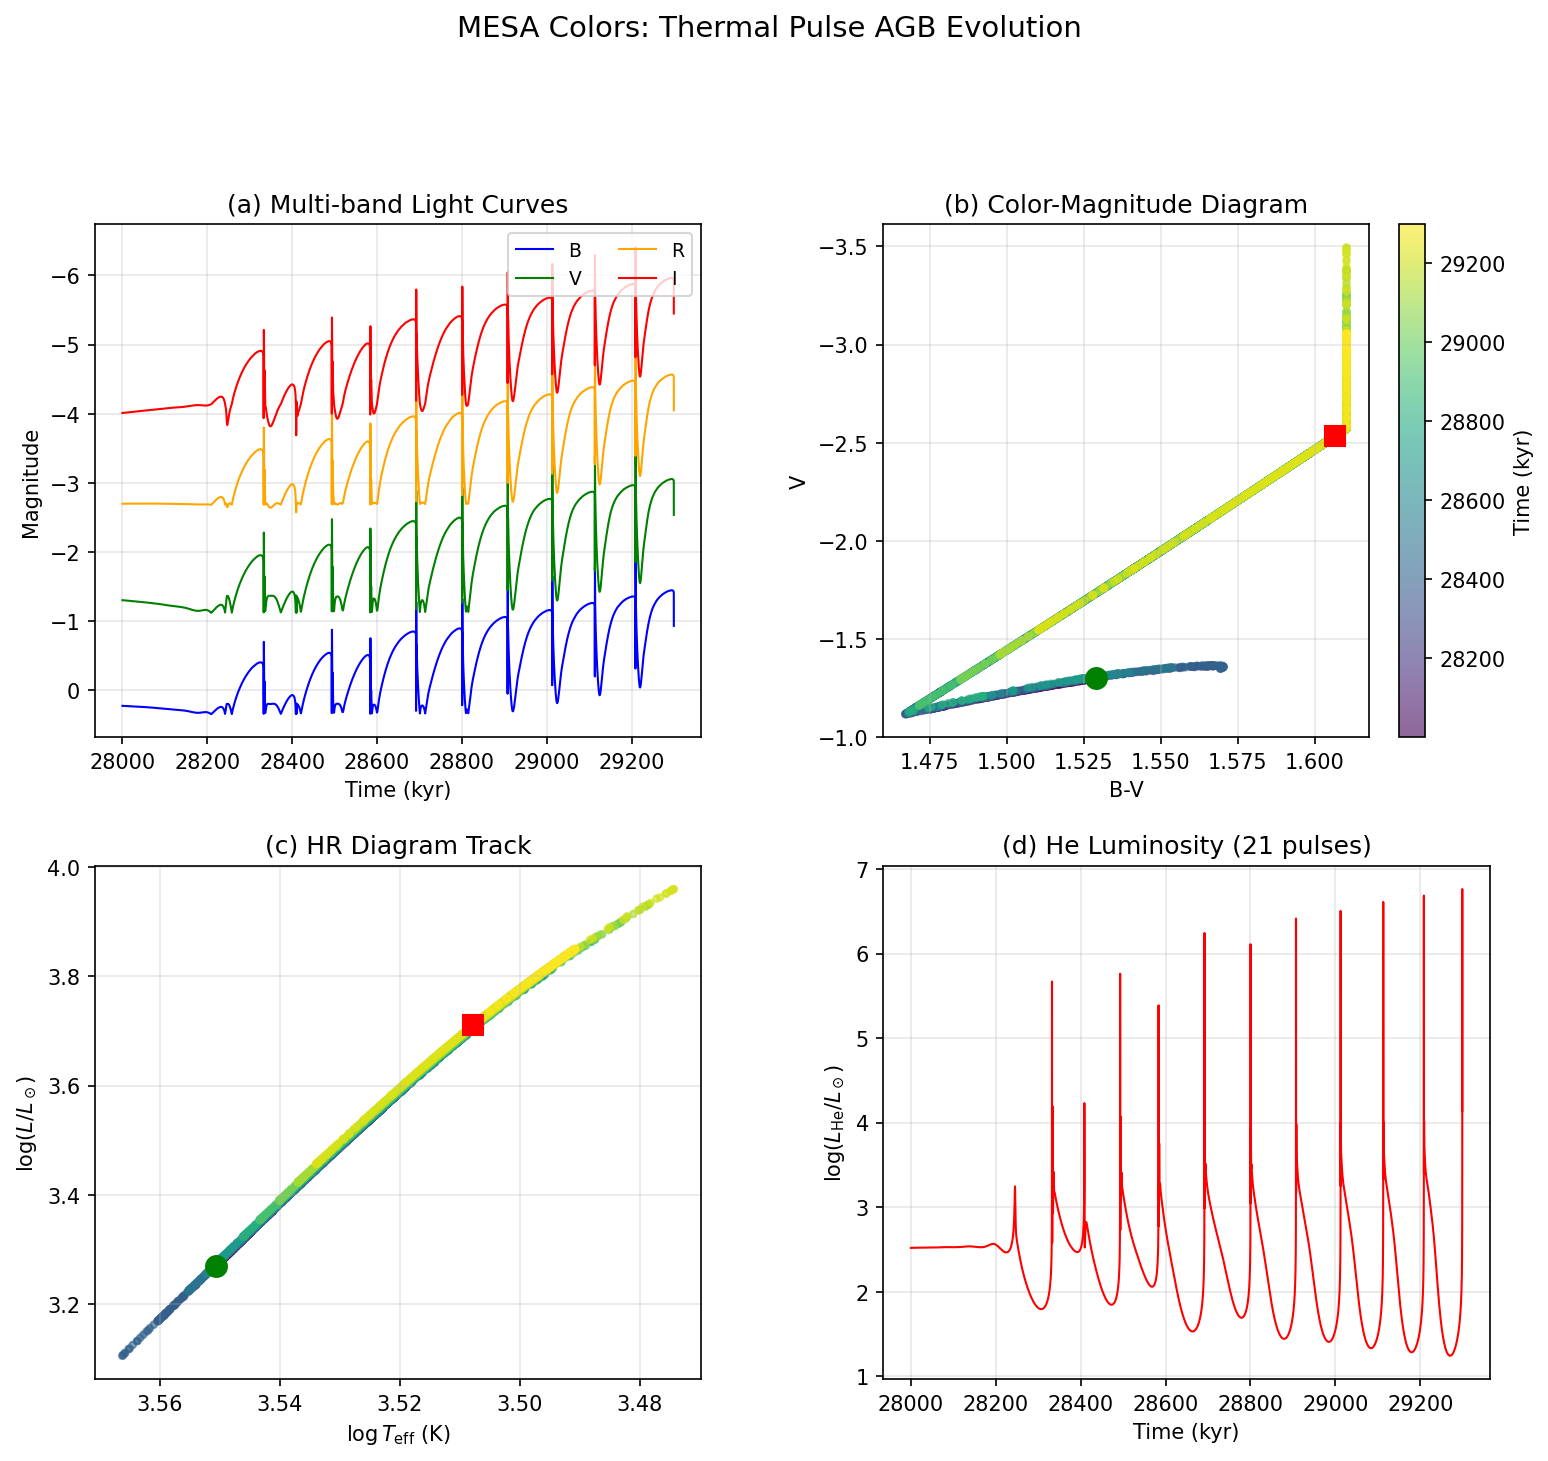
SED_check.py
Usage: python python_helpers/SED_check.py
Monitors the colors_results_directory (default: SED/) for new CSV output.
Features:
- Plots the full high-resolution stellar spectrum (black line).
- Overlays filter transmission curves for verification.
- Useful for debugging spectral energy distributions.
Gallery
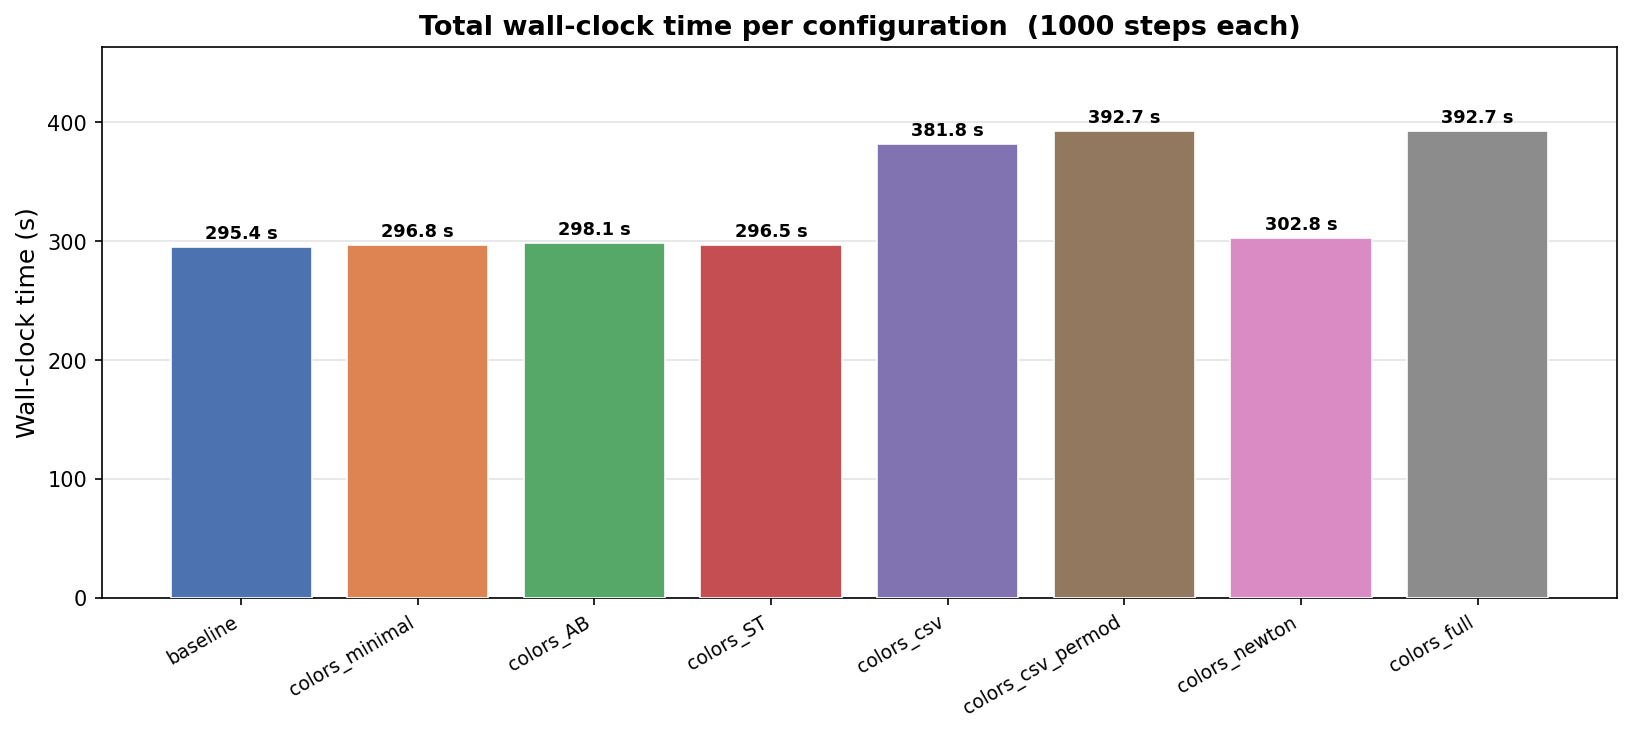
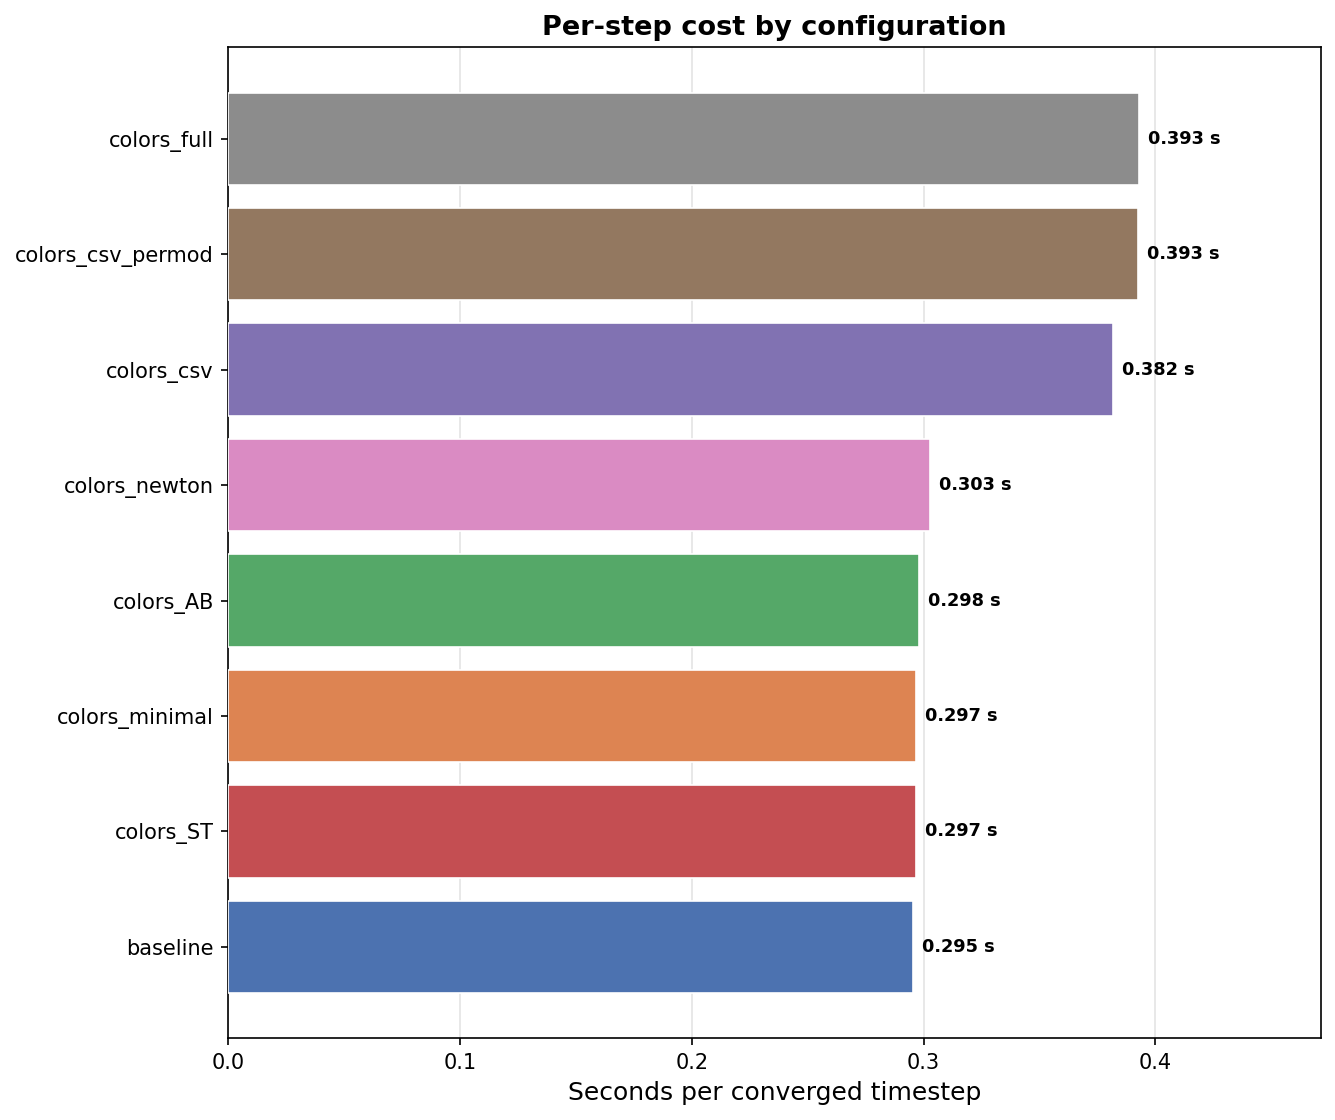
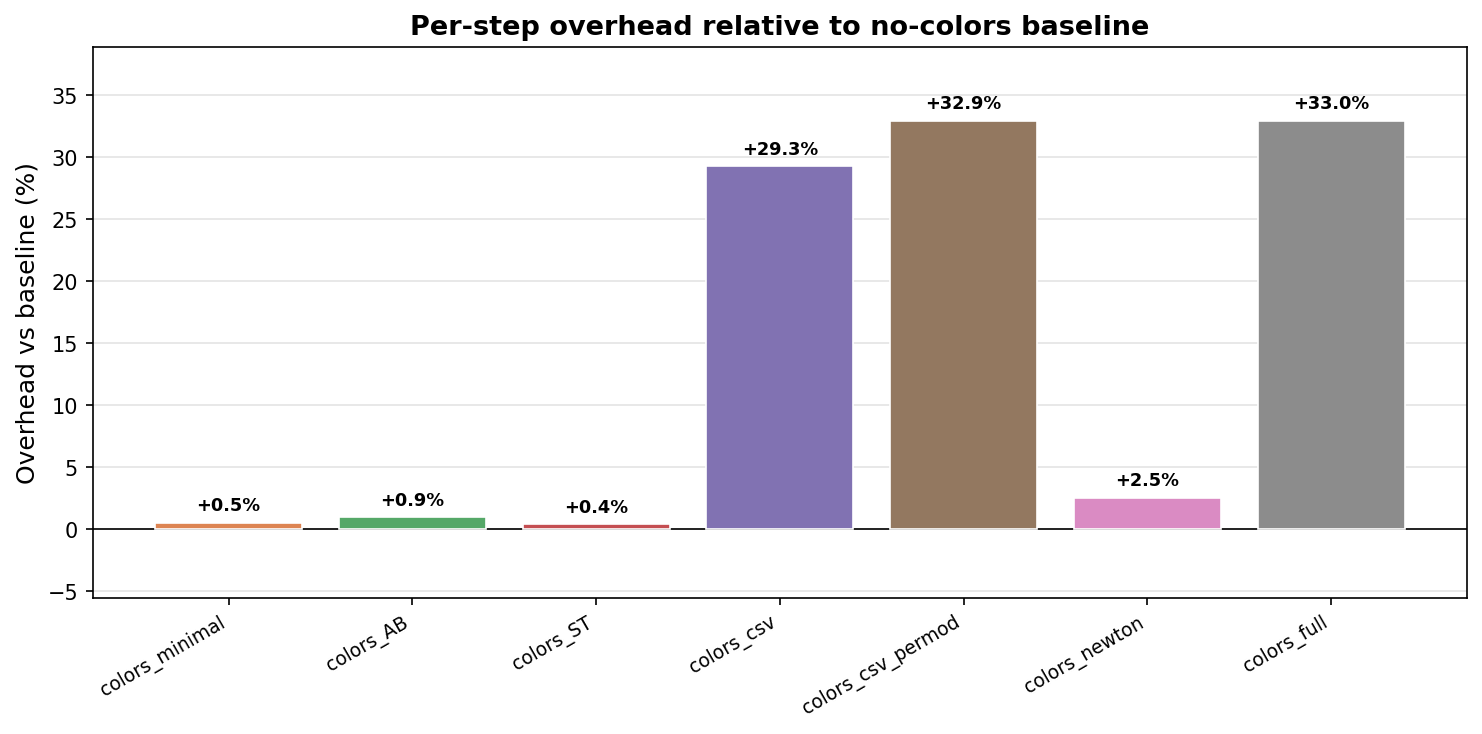
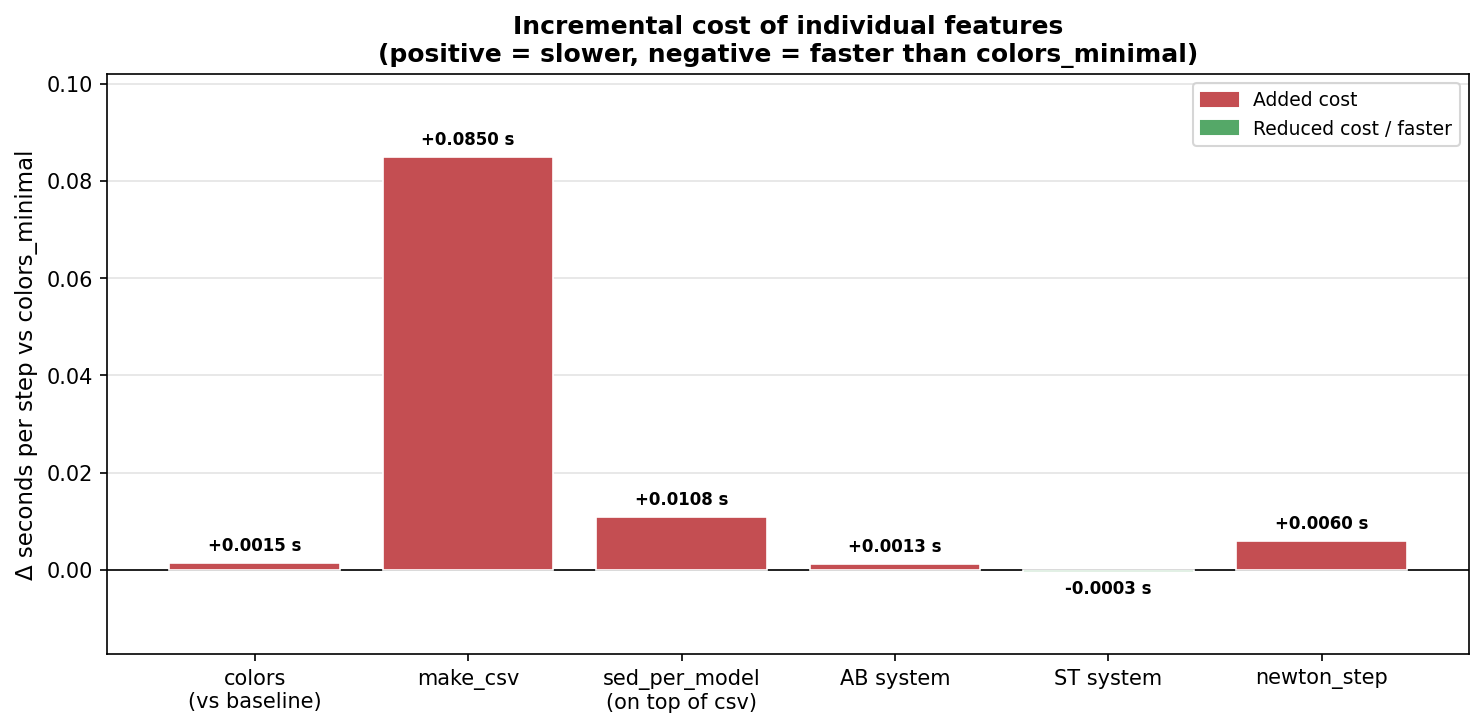
Timing Tests
To characterise the computational overhead of the colors module, a timing suite was run across eight configurations, each evolving the same stellar model for 1000 converged timesteps. The baseline is a vanilla MESA run with colors disabled; all other configurations add features incrementally. Results are fully reproducible via the test_timings.py script in the custom_colors test suite ($MESA_DIR/star/test_suite/custom_colors/python_helpers/test_timings.py).
Summary
| Configuration | Description | Wall time (s) | s / step | Overhead vs baseline |
|---|---|---|---|---|
baseline |
No colors (pure MESA) | 295.4 | 0.295 | — |
colors_minimal |
Colors on – Vega, no CSV, no Newton | 296.8 | 0.297 | +0.5% |
colors_ST |
Colors on – ST magnitude system | 296.5 | 0.297 | +0.4% |
colors_AB |
Colors on – AB magnitude system | 298.1 | 0.298 | +0.9% |
colors_newton |
Colors on – Vega + colors_per_newton_step |
302.8 | 0.303 | +2.5% |
colors_csv |
Colors on – Vega + make_csv |
381.8 | 0.382 | +29.3% |
colors_csv_permod |
Colors on – Vega + make_csv + sed_per_model |
392.7 | 0.393 | +32.9% |
colors_full |
Colors on – all options enabled | 392.7 | 0.393 | +33.0% |
make_csv, which writes a full SED spectrum to disk at every profile interval and accounts for ~29% overhead on its own. Users who do not need the SED CSV outputs can run the full colors module at essentially no computational cost.
Figures
Additional Resources
Official Documentation
Community Resources
- GitHub Repository - Source code and examples
- Summer School Lab Materials - Complete lab guide and exercises
- Zenodo Archive - MESA 2025 Summer School pre-release
Contact
For questions, bug reports, or collaboration inquiries:
- Niall Miller - Project Lead
- Prof. Meridith Joyce
- Dr. Phillip Mocz